5 Bending Water Project at the Claremont Colleges
Jeanine Finn and Catalina Lopez
Water: It is the source of all life in this incredibly beautiful part of the planet.
The Western Water Archives are a wide-ranging collection of primary sources about water history in California and the US west over the past two centuries. This archive is complex to handle and potentially rich in data sources for understanding western water issues.
Building on the success of the CLIRWater grant, in 2019 a team from the Claremont Colleges applied for a grant from the Mellon Foundation’s Collections as Data project. The Mellon Foundation awarded a $750,000 fund for this widely collaborative project to principal investigators at the University of Nevada Las Vegas. These funds have been re-granted to seven cohort teams for the 2020–2021 period with the ambitious goal to make already digitized heritage materials more accessible to computational methods, as well as surface the histories of groups and individuals that have been marginalized by previous archival approaches. The Claremont Colleges Library was awarded one of these grants in January 2020, just a couple months before the pandemic shut the world down.
This grant is unique and really appealing to us in that part of the project deliverables are to explain our processes and our workflows as well as to deliver a dataset. This has been useful to us in that we wanted to document the kind of outreach and engagement necessary to make this a meaningful project—and of course, since March 2020 that kind of outreach and conversation has been complicated in a socially distanced world.
There is a rich diversity of material types across this collection, so many different types of provenances, and just a huge number of items. Approximately 13,000 items were digitized under the CLIR grant. We have decided to focus on approximately 1,100 items within the collection that have been identified as “dataset” in the initial metadata. This includes primarily tables, but also a few charts and maps.
We have started with graphs and tables like the one you see in Figure 1:
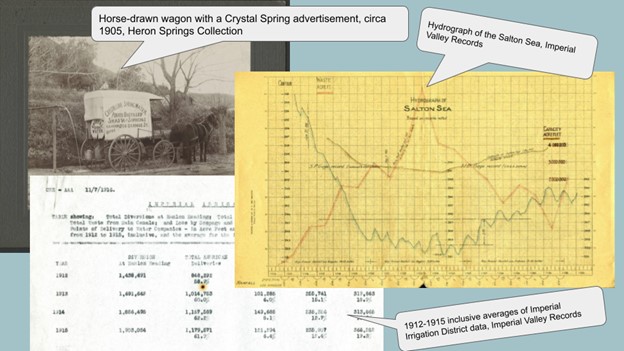
Other archival materials—like longer narratives and photographs—could benefit from “datafication” and might be on the agenda at some point, but we decided to begin our analysis with some of the more obvious “data” as our low-hanging fruit.
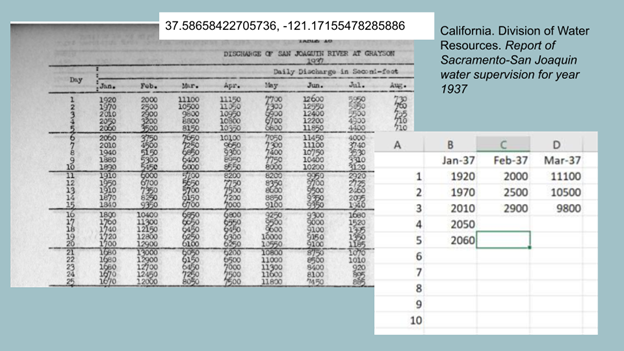
Briefly, our first strategy is to improve computational accessibility for some of the tabular data. These are mostly observational reports related to things like dam discharge, streamflows, and other notes on surface water and groundwater that were relevant to irrigation and municipal water projects. We are making these images of data sets into a tabular format, so they are more accessible to computational methods. We are also working on improving location data, such as latitude and longitude measurements, as you can see in Figure 2:
The second focus of our initiative is to surface the stories of the Indigenous communities in California whose water resources were decimated by the settlers and industrialists in this part of the country. These are peoples and communities whose histories remain largely hidden in our current archival arrangements. The bulk of our materials were obtained from developers, industrialists, and municipal water districts that worked to promote settler interests for the most part over the objections and concerns of their Native neighbors.
How do we bring Native communities and voices into conversation with these archives? We are starting by listening. We are meeting with Native groups in California including the Tongva, the Paiute, the Owens Valley Indian Water Commission, and some of the eastern California nations including the Pechanga and Cahuilla, to get a better understanding of what their current projects are and what their needs might be.
Native communities in California confront a diverse range of challenges related to water, grown out of unique environmental constraints and varying ways that settler laws and policies have displaced Native inhabitants throughout the state, as well as the water itself. Projects such as the construction of Los Angeles Aqueduct in the early 20th century literally moved water from the central part of the state to increasingly thirsty urban areas in southern California. Tribal leaders and water activists from this area are looking to reclaim some of this water that has left their lands as literal dust and a once-green landscape difficult to farm. Meanwhile desert tribes carefully monitor extremely fragile ecosystems with careful study of native plants and animals in their regions to ensure sustainability.
Given this range of priorities and needs we have no precise, one-size template for how we will surface stories of Native community members across historic water collections. We are looking at adding native place names to metadata, sharing Native-made maps alongside western maps, and other collaborations led by the interests and objectives of our community partners.
These elements are part of this project’s iterative process, and we are reaching out to particular tribal organizations working on water issues to tell us how we can best support their work in an ongoing and flexible way.
So, what is the current work of the Bending Water Project?
Because a significant contribution of this grant is the focus on implementation work, we are doing a lot of documenting of technical processes along the way. We are sharing methodical artifacts (such as digitization workflow diagrams and instructional guides) in the hope that future projects can learn from our successes and our mistakes.
Another major part of our current work is our outreach and engagement. While meeting with individuals and groups simply takes longer to arrange during the pandemic, over the past few months we have had illuminating conversations with several types of potential audiences and users of this collection. We have met and conducted semi-structured conversations with focus groups of researchers, individual librarians and archivists, as well as with Indigenous community members and scholars. We are analyzing this qualitative data with an eye toward identifying some themes that may be common across digitization and data recovery projects that involve multiple types of stakeholders.
When we joined the Collections as Data grant, we accepted their ethic of developing digitization and preservation practices that are incorporated into host institutions in sustainable ways.
The ethics of Collections as Data are most concretely expressed in the group’s Santa Barbara statement of principles. Principle 10 addresses sustainability by directly speaking to issues of staffing and technical support:
“The development of collections as data is an ongoing process and does not necessarily conclude with a final version. Work in progress status can be seen as a virtue when iteration is geared toward developing productive collaborations and integrations between new and existing technologies, workflows, and service models. The ongoing development of collections as data can impact staffing models, workflows, and technical infrastructure.” The Santa Barbara Statement on Collections as Data, 2020, https://collectionsasdata.github.io/statement/.
One of the ways we have sought to do this is by tapping the interdisciplinary expertise of our library colleagues, building a community that will enable us to continue the work after the grant period concludes. One way this team-based approach has already borne fruit in our collaborative efforts to resolve several technical challenges in working with the digital files. There has been a good deal of previous study and documentation in libraries using optical character recognition (OCR) for archival materials, but there are not well-established standards for turning some of this material into data sets. As part of our initiative, then, we are developing some prototypes and pilot projects, innovations that Catalina Lopez will now describe.
My name is Catalina and I am the project manager for the Bending Water project. We have been working on developing the computational accessibility of the materials in the California Water documents collection that contain water data. The three types of data materials we are focusing on are the charts, maps, and tables in this collection.
We are looking into making this data into CSV formats. CSV stands for comma-separated values, and it is a widely used format for scientific analysis. This format stores tabular data, which is composed of rows and columns and is present in the tables within the California Water Documents collection.
Our first goal was to identify what kinds of data are archived in the California Water documents collection. To do so, we extracted the metadata records for the collection from the metadata storage application CONTENTdm, which is the application that the Claremont Colleges Library uses to store and display the metadata records for the California Water Documents collection. Currently, there are 13,746 objects in that collection, which includes photographs, letters, documents. We then narrowed down the records in that list that contained the term “dataset” in its metadata; this term was created by the CLIR project when it created the metadata records for these objects. Once we narrowed down the collection list to datasets only, we found that there were over 1,100 objects that were datasets.
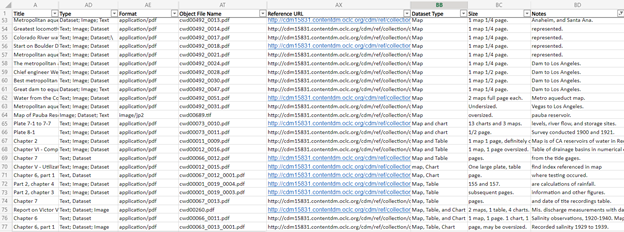
Kenneth Cotich is our data review specialist for the project and went through all 1,100 objects to assess what kinds of charts, maps, and tables are in the collection. This screenshot is the Excel sheet that we extracted from CONTENTdm that is filtered to the collection’s approximately 1,100 data sets. All the headings you see in this sheet (Title, Type, Format, Object File Name, etc.) are required fields that are stored in CONTENTdm. You are able to view these fields in the public site of the collection in the Claremont Colleges Digital Library: https://ccdl.claremont.edu/digital/collection/cwd. At the top where it says the Type field in the top left, you can see where the term “dataset” is in that list. We filtered out the items in the collection that solely had “text” and “image” in the Type field because we are focusing on items that have a “dataset.”
Now that we knew which objects in the collection had datasets, it was time to work on the OCR process. OCR stands for optical character recognition, which means the electronic or mechanical conversion of images of typed, handwritten, or printed text into machine and coded text. The OCR application that we decided to use for this project is ABBY FineReader.
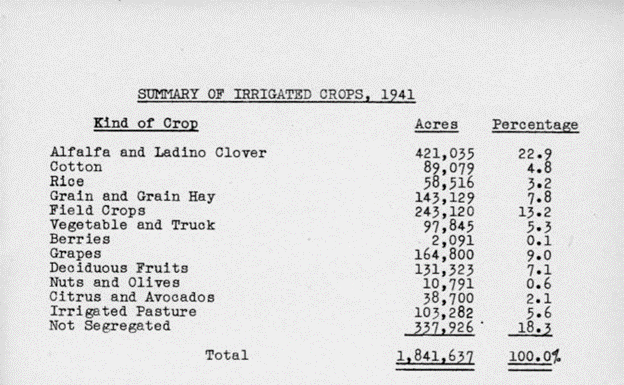
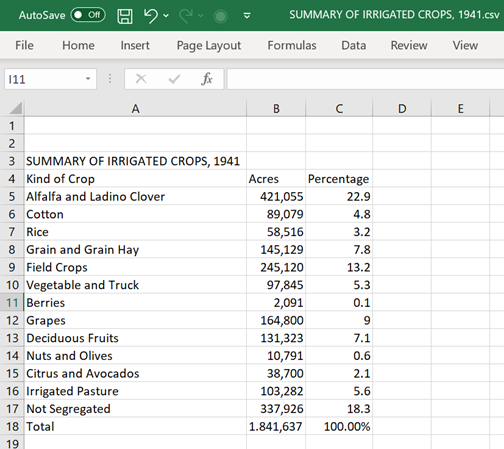
This table from the collection is a summary of irrigated crops from 1941. This table is found in the digitized object called Report on irrigation districts in California for the year 1941 by the Division of Water Resources. An example of using the table could be to compare percentages of crops and amount of water used for irrigation.
We imported the table into Abby FineReader to demonstrate the conversion of a PDF into a CSV file.
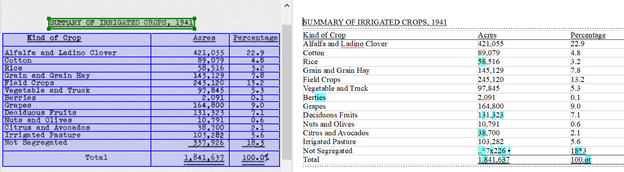
Here is what the table looks like in ABBY FineReader. On the left is the original PDF with the table, and ABBYY FineReader recognized the title, “Summary of Irrigated Crops of 1941” as plain text, highlighting it in green. The table is highlighted in blue to show that it was recognized as a table.
ABBYY FineReader converted the title and table on the right side and kept the same table format of the original PDF. Now you can see that there are some light blue highlights in the converted table that may need additional attention. These highlighted areas are called low confidence characters. ABBY FineReader wants the user to verify that these areas were converted correctly.
I’m going to show you an example.
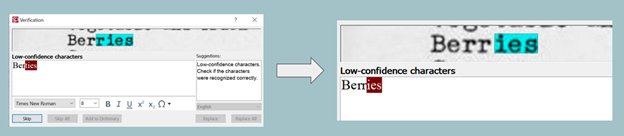
The highlights can pop up by clicking “Verify” on ABBYY in order to correct the low confidence characters. The word “Berries” was converted with a “T.” We can manually fix the text, and it will implement that in ABBYY FineReader.
Here’s another example in this particular table.
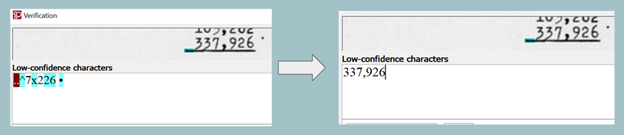
There’s a number 337,926. ABBYY recognized that number and converted it with different characters instead of numbers. But again, we can edit it and type it correctly as shown.
Once we go through all the highlighted areas, the document is ready to be exported.
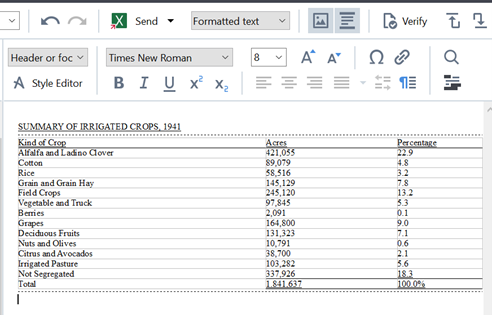
And this is where we want to eventually put them into CSV files. We then exported the CSV file and opened it in Excel for right now to look at the CSV files, but as you can see it is a clean conversion from the PDF of the table.
The next step for the Bending Water project would be to eventually put these tables into some data repository, such as a Dryad or Zenodo, where scholars can eventually download and use the CSV files in their research.
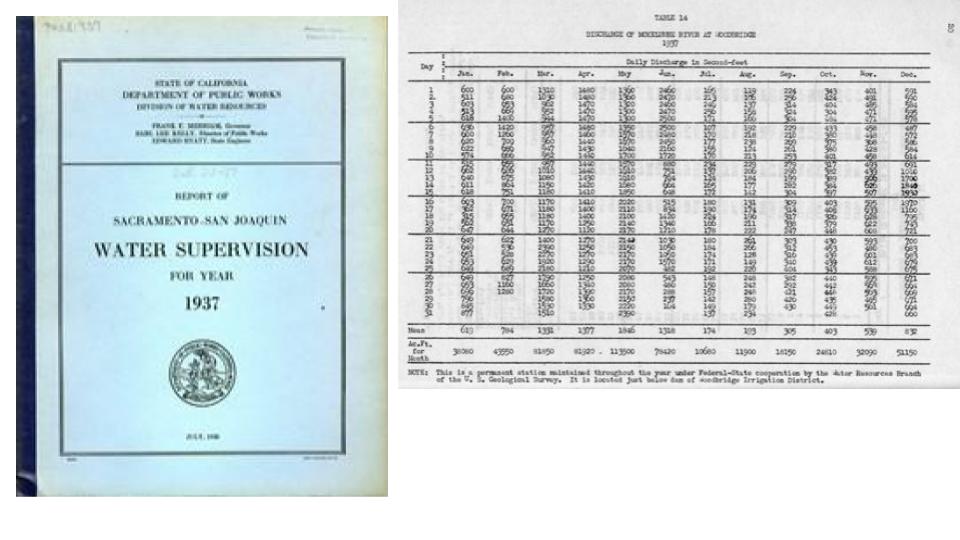
Here’s another example of a table, this is the Discharge of Mokelumne River at Woodridge. I want to acknowledge that the location of the Mokelumne River was originally inhabited by Yokuts, Miwok, and Wintun Native American people.
This particular table is found in the Report from the Sacramento/San Joaquin Water Supervision published by the California Department of Public Works in 1937. It shows the daily water discharge in second-feet for each day from January to December of 1937. One way a researcher could use this data could be to calculate the different discharge measurements by month.
We will repeat the same process as the previous table and upload the PDF of the table into Abby FineReader.
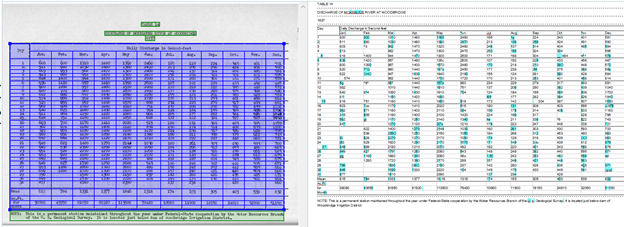
You can see on the left it recognized the text areas of the table, highlighting them in green. It also recognized the table and highlighted it in blue.
This table converted on the right has a lot more light-blue areas, or low confidence characters. Once we repeat the process of verifying and correcting the low confidence characters, this is what the table looks like when it is exported as a CSV file and uploaded into Excel.
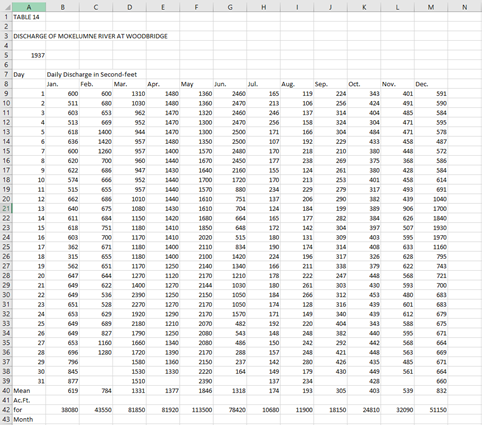
We now have the same table from the PDF, and now it can be used by researchers in an easier format.
Now, there are challenges when using Abby fine later, we noticed that the OCR process in ABBYY was not compatible with any of the charts or maps that we have in the collection.
Another challenge is that some of the tables contain multiple headers. We determined that having multiple headers was not going to be compatible in CSV format. These challenges are evident in Figures 13, 14, and 15:
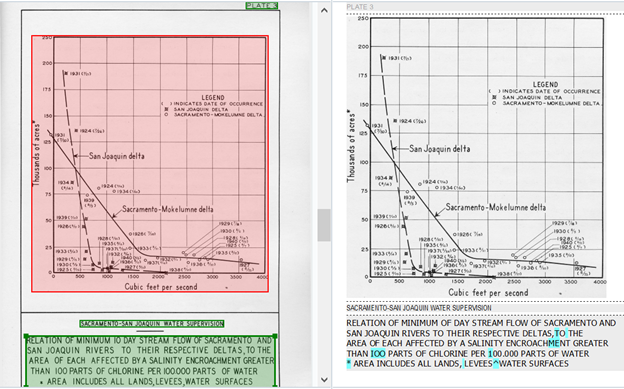
Here is a chart from the collection. It is from Chapter VI Salinity Observations, and it measures the acres of the San Joaquin delta and Sacramento-Mokelumne delta in cubic feet per second. When it is uploaded in ABBYY, the chart is highlighted in red, whereas before, the tables were highlighted in blue. When something is highlighted in red, that means that Abby FineReader can only recognize it as an image. And we don’t really need an image imported in Excel. It also won’t convert the chart’s calculations as a CSV file. That means we will have to look at other outlets in converting the charts into some other type of computational data.
Here’s another example using a map, which constitutes Figure 14:
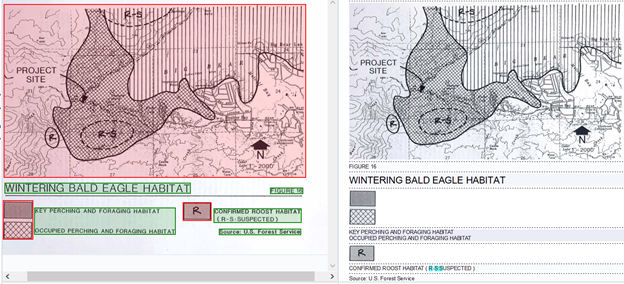
This is a map of the Wintering Bald Eagle Habitat from the Draft of Environmental Assessment and Impact Report on the Bear Dam Rehabilitation Project. This habitat is located in Big Bear.
When the map is added in Abby FineReader, it is only recognized as an image similar to how the chart was seen as an image in the previous example.
Figure 15 offers another challenge that emerges when trying to convert tables.
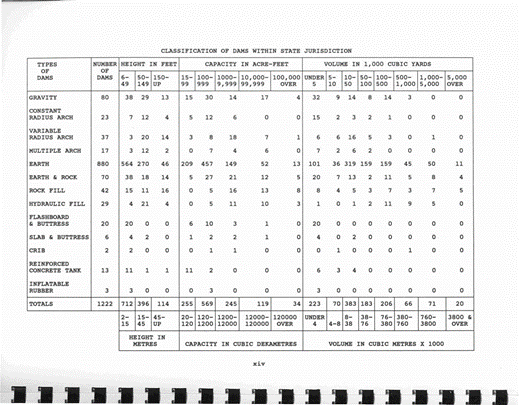
This table, Dams within Jurisdiction of the State of California, 1993 June, was published by the California Department of Water Resources. It classifies dams within state jurisdiction in California by displaying different types of dams on the left-hand column. The top 3 headers include height in feet, capacity in acre-feet, and volume in 1000 cubic yards. Then there is another header placed right below. It appears that there are three different tables within a single table. We are still exploring how and if we should separate the multiple tables.
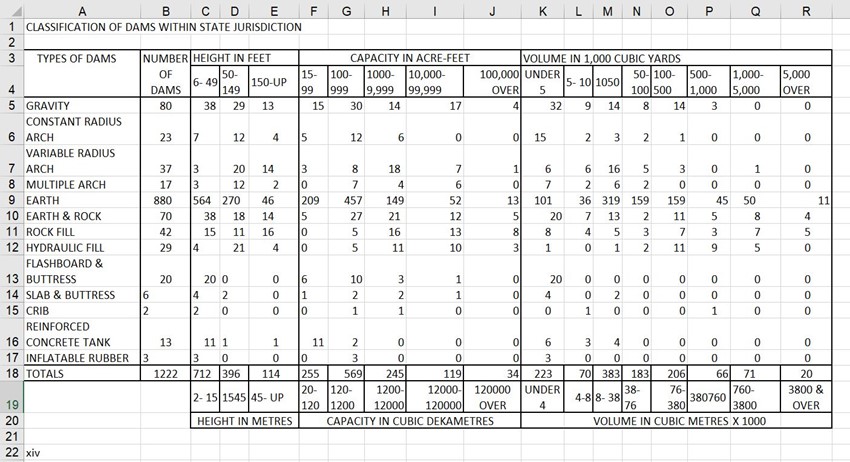
Here is what the table looks like in Excel.
So, the next steps are to determine how to convert the maps into ArcGIS, which is a geographic platform. We also want to look into storing the CSV files into a data repository, which is a tool that allows one to store data files for others to download and use for their own research. Two data repositories we’re looking into are called Dryad and Zenodo. In our case, we would upload the CSV files of tables into a data repository where others can view and download them.
Another goal of this project is to enhance the metadata of the datasets to include indigenous place names. Earlier, I shared a table of the Mokelumne River, but in the metadata of the objects in the California Water Documents collection, it does not recognize, or acknowledge the original inhabitants of that area.
If you would like to learn more about the Bending Water project or explore the California Water Documents collections, please visit Bending Water blog site: https://bendingwater-blog.library.claremont.edu/. The homepage also includes the link to the larger collection.
A final request: We are conducting a survey to learn more from our scholars, and it is a 10-minute survey that can help us learn more about how the Bending Water project team may develop a meaningful and accessible project to suit the needs of scholars and Indigenous communities using water data in their research and advocacy.
