3 Sustainable Water Projects
Sami Maalouf
Let’s start with a global view of water and then bring the story down to an individual level because it is at the individual level is what matters in terms of our consumption of water, where we move it from and how we consume it.
This is critical given that the Earth’s human population has seen a massive increase over the last century. As an example, during Frank Brown’s years manipulating water supplies in Redlands in the late nineteenth century, the global population was relatively very small compared to the population today. At the turn of the twentieth century, there were roughly two billion people; in 2021, we are approaching about 8 billion. We are not the only species that needs access to water. It is, of course, essential for all species. Such need makes the distribution of water so critical.
Its distribution is especially significant because most of us prefer to live around coastal plains and coastal zones. About 70% of people live roughly 70 kilometers away from the coast, if not on the coast itself.
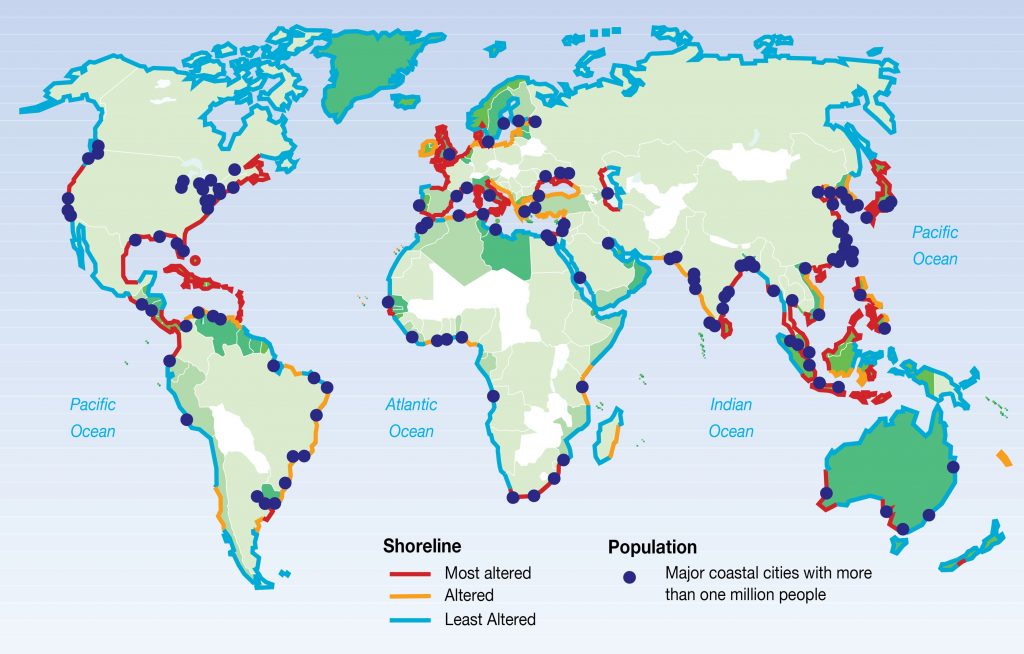
It is in this zone that you find a number of mega cities. On the West Coast of North America, for example, Vancouver, Seattle and Portland to the north, and San Francisco, Los Angeles and San Diego to the south. This is a global phenomenon (places like Mumbai, Lagos, Shanghai, Rio de Janeiro, to name a few) that requires us to adjust how and why we import water into these metropolitan centers, much as we must do in Southern California.
To sharpen my students’ understanding of this issue, whenever I teach Engineering Hydrology, I ask them to monitor their water consumption for one week. These are two samples from a survey conducted in the class (all units in US gallons).
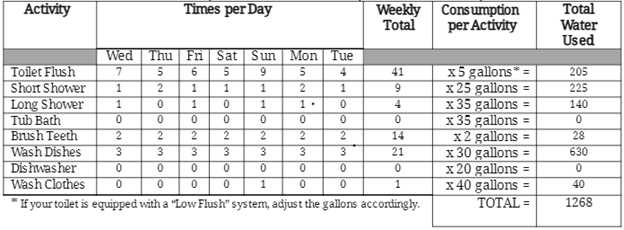
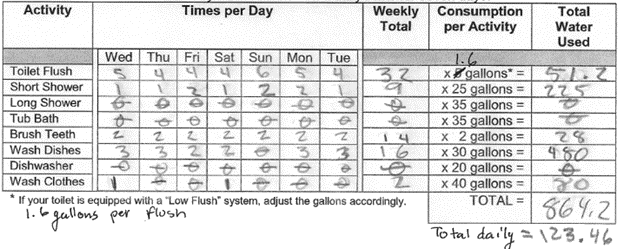
Even I was surprised how much water my students consume. The first breakdown from the two samples above shows a total of 1268 US gallons per week (an average of approximately 181 US gallons per day). The second breakdown shows an average of approximately 123 US gallons per day. The latter sample’s household is equipped with a low flush toilet. Keep in mind that these are personal consumptions and they ignore watering lawns, irrigating plants or washing vehicles. The survey also ignores personal consumption of drinking water and cooking.
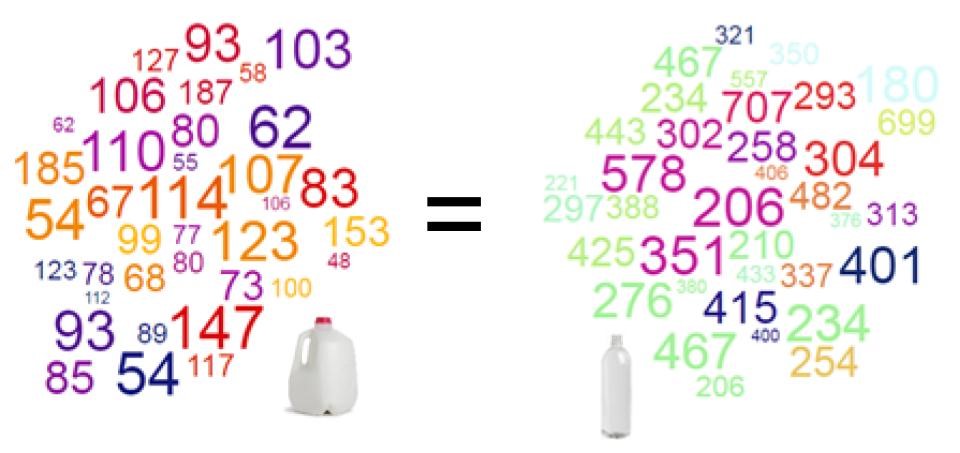
The first step in evaluating the survey was to convert US gallons to Liters. For example, the 181 US gallons per day above became about 685 Liters per day and the 123 US gallons per day above became approximately 486 Liters per day. The second step was to show my students a visual variation between the size of one US gallon container and that of a one Liter bottle. As it turned out, once you shrink the size here and you change the unit there, some folks started thinking, “wow I consume so much…685 Liters per day!”
I later compared my students’ personal consumption with that of an average individual in Frankfurt, Germany. The average consumption in Frankfurt is about 122 Liters per day; a stark contrast to my beloved students (averaging close to 400 Liters per day, if the entire survey of the whole class is considered). We always hear about the agricultural field taking all the water—and it does, up to 80%. But we also must address individual consumption subject matter.
| City | Residential Use | Total
Use* |
| Vancouver, BC
Nanaimo, BC Portland, OR Los Angeles, CA San Francisco, CA Melbourne, Vic. Sydney, NSW Frankfurt, Germany |
282
242 219 376 172 150 207 122 |
471
429 390 547 295 238 312 142 |
*Total use includes industry and agriculture.
Table 1. Water use per capita, Liters per day. Data sources: UC Davis, Metro Vancouver, City of Nanaimo, City of Frankfurt.
So, the table above shows a residential total of 122 Liters per day, per capita (per person) from Frankfurt. A total, including industry and agriculture, would be about 20 Liters in addition to the residential use, totaling a consumption of 142 Liters per day. The table shows that we are number one! Let’s see what we pride ourselves to be number one in. Many things! Definitely in the case of freshwater withdrawal. To put it in perspective, if we include all the demands (residential, industrial, agricultural, leisure, etc.), we take about 4141 Liters per day per person, on average, from nature. Converting this demand to US gallons, we take an average of 1094 US gallons per day per person (data not shown). If we compare this to, for instance, Germany again, it will be about four times more than the German demand (approximately 1097 Liters per day per person or about 290 US gallons per day per person).
Please note that the inhabitants of the cities shown in Table 1 above live in industrialized countries and are similar to the residents of United States in many ways. For example, every time they’re thirsty, they have water to drink so they’re not fetching water from somewhere far away and suffering a great deal. What is the basis, then, for the US West’s hydraulic empires? Why did people like Frank Brown, whom Heather Williams focused on, want to exert absolute control over water in the Inland Empire? It seems that he and others wanted to quench their own capitalist thirst. They invented cities in the US West and, to do so, sought to maximize their profit through the capture and distribution of water to these new communities.
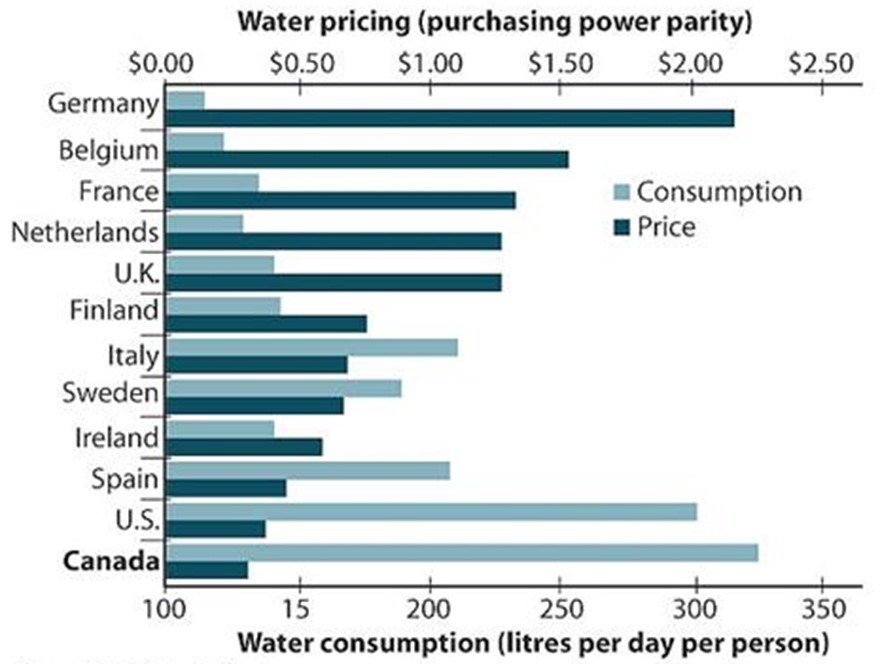
To answer some of these questions, let us look at Water pricing versus water consumption figure below. Germany, again, versus the US. In this manner, you see a reversal in the pattern in that Germany’s consumption is very little, but the cost of water is quite high, per liter (or per gallon). If you look at the US, this is exactly the opposite. Here, the consumption is quite high, and the price of water is reasonable. But compare this to Canada and you will now surely say, “you see that they have even more consumption than us.” Luckily, for the Canadians, they have more access to water than those living in semi-arid lands, such as the region we live in. Yet, their water price is quite reasonable as well. This is something to think about. I’m not advocating to raise the cost of water but maybe it is time to start thinking of how to deal with its consumption somehow in a good and sensible way.
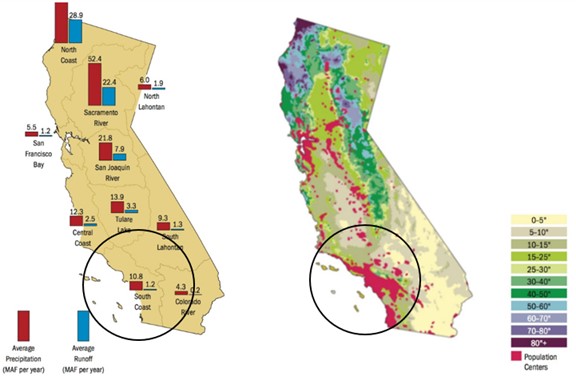
Speaking of arid lands and looking at Figure 5 below we see, on the left-hand side, a map of this state with various hydrological zones. We live in the area where the circles are drawn, and you also see that there is some precipitation and not so much runoff in our region. On the other hand, if you look at the right-hand side, you will notice that the scarcity of rainfall versus population centers and you may start to think, “Why do people do that to themselves? Why do they migrate to an area where there’s hardly any water?”
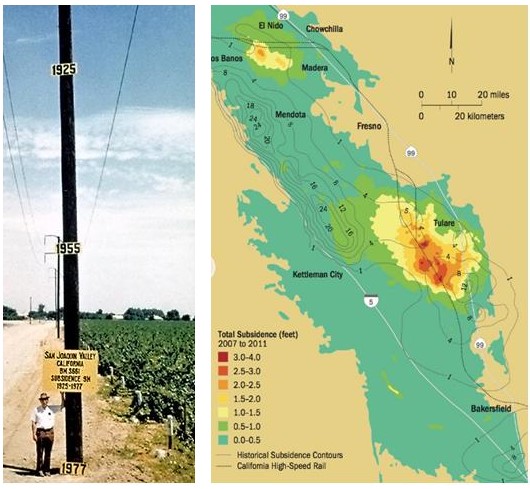
One historic solution to the scarcity we faced was to tap into local groundwater aquifers. An example of how intense some groundwater pumping has been is captured in an iconic image of land subsidence in the San Joaquin Valley in California (Figure 6 (Left), retrieved from https://www.sciencebase.gov/catalog/item/58335611e4b046f05f21f69f). You will find a great deal of subsidence that took place as we emptied out the aquifers in the Central Valley as well as in Southern California. Relying on groundwater alone is not really sustainable.
This is particularly true of the Southland’s coastal aquifers. Once heavily pumped, these geological formations have been compromised by saltwater intrusion, polluting this resource and making it hypersaline. To continue utilizing groundwater, in the aftermath of seawater intrusion, municipalities (cities) have to spend lots of money to treat the polluted groundwater.
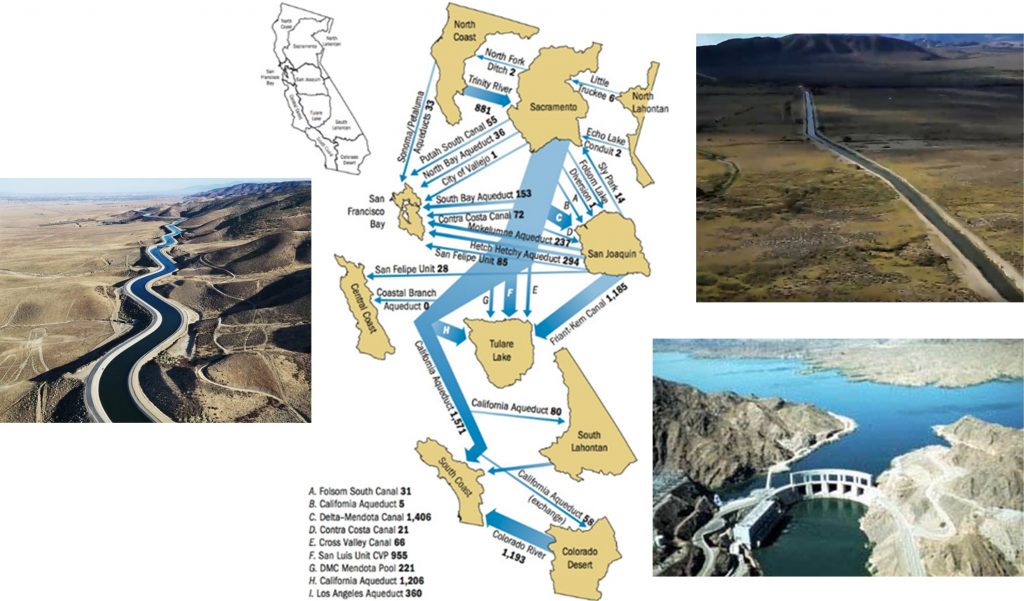
Once those sources (groundwater) had been undermined, some urban centers in the Western US searched for water elsewhere and started to import volumes of this vital resource from faraway distances into their cities. Look at the complicated regional water imports and exports network in our state (center, Figure 7). Examples of how these movements take place are captured in the three photos that show (top right) portions of the Owens Valley Water Project (courtesy: LA Times), portions of the Colorado River conveyance system (bottom right, courtesy: American Society of Civil Engineers, ASCE) and portions of the California State Water Project (left). Of course, all these three projects are aqueducts (as you can notice) that are open to the sky, passing through long stretches of hot areas (semi-arid to arid regions of the world) and, along the way, a great deal of evaporation takes place. So, there goes millions of gallons or liters of precious water. Perhaps it is time to start shifting the paradigm!
You also hear about desalination as a proven technology that started out in the US. As a matter of fact, President Thomas Jefferson wrote about it. He discussed desalting water for the naval fleets and did not think about it in a very large scale. But, of course, capitalists and geniuses of sorts, with stockbrokers and what have you, thought about it from a business point of view: Sell it to the public as a drought-free technology and don’t tell them the whole picture. In essence, they’ll bring you just parts of the picture because they don’t want to bore you with the technicalities inside!
Here’s the full picture: After a great deal of time, about 60 or 70 years of distillation and energy guzzling desalination technologies, researchers found that reverse osmosis (RO) or forward osmosis (FO) would be a more feasible type of technology in that it costs less than its predecessor. Keep in mind that this technology still costs considerably more than bringing water from one place to another, but still costs less, by comparison, to other technologies that remove salt from water. Briefly, you bring water from the sea (or ocean), you pass it through some kind of high-pressure pump that pushes seawater onto the RO membrane train that in turn allows clean water through and captures salt and contaminants. We call this clean water “permeate.” The rejects are referred to as “concentrate.” In reality, if you go quickly in the process, you can collect the permeate, take out the salt and dump it back to the ocean (see Figure 8).
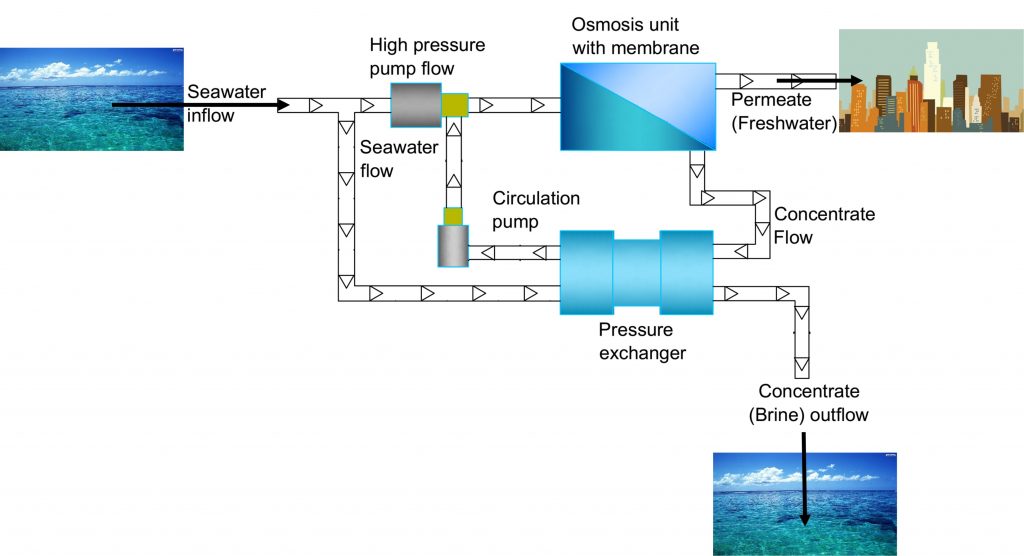
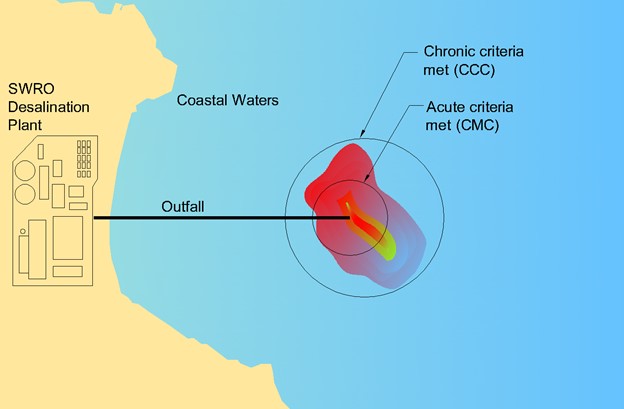
So, the permeate goes to the city and you will enjoy this water supply after treating it and later drinking it. The concentrate, however, goes back to the ocean (or the sea). You may think now, “we got water from the ocean, ran through the RO train, got the permeate and then dumped all the remaining waste back to the ocean.” The ocean is the source and also the sink. What really happens within the process of desalination, as there is a great deal of intake and along with the seawater you can imagine fish and other marine creatures impinging into the RO plant. Brine, or the concentrate is usually dumped back into the ocean, hurting marine life. One really bad thing about RO as a technology is that it sends out a hypersaline plume that consists of almost twice the salinity I talked about earlier (Figure 9). In other words, if the influent is 30,000 parts per million, the effluent would be 60,000 to 70,000 parts per million. This is a schematic, a representation of sort, to show you how the effluent starts creating a “dead zone” within the ocean. Keep in mind that if this zone grows, it will also impact the intake that is usually nearby. With such events, the RO plant will require far more thrust to deliver exactly the same outcome that it was designed for. So, this is not a very sustainable technology, per se.
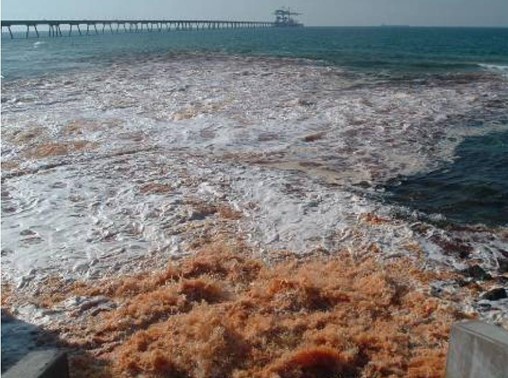
You could say that well you’re showing me schematics, what about real pictures? This is a photo of a plant in Oman. I hope they plan to install an outfall at some point soon. The plant dumps the effluent immediately after the process is done at the coastline. So, by doing so, the dilution process will take a lot longer time because, as you probably know (from swimming along the coast), the area near the beach is usually very shallow and as you go away from the coastline the deeper the sea gets. Then, as water becomes a little deeper, mixing may become more and more effective and the dilution process is a bit better. Another example is along the eastern Mediterranean coast. This is from the City of Ashkelon’s RO plant, where they do the same thing: dump all the hypersaline water back into that coastal waters (without an outfall). A colleague of mine sent me this horrendous photo (see Figure 10). This is an invitation to the demise of marine life, possible growth of harmful algal blooms and other adverse problems, just in the name of augmenting the water supply system with more fresh water. Naturally, you can see that this is not a sustainable way to live, in the long term.
Recycling, Recharging, and Other Initiatives
Keep in mind that most people who migrated to California came from somewhere else, often from areas that are lush and green. They never consulted with local Indigenous people, who really know the land for millennia. William Mulholland, much revered (and also reviled) in Los Angeles, hailed from Ireland. To make Southern California as lush, he proposed to move water to this semi-arid landscape via the controversial Los Angeles Aqueduct. His actions were not only unsustainable but ridiculous. That’s an audacious word (i.e., ridiculous), but words can be triggers to action towards an evolution of the state’s and the region’s water policies.
So, what can we do individually? What we’re seeing nowadays is a real and serious effort to start using recycled water a little more. If we can really tap this resource into our portfolio, a considerable volume of water will appear. Let us look into this a little further: Open the tab or just take a shower and you will find out that most of the water you use goes away (just about 90% of it, or perhaps a little more) down the drain. Most of this is what we refer to as ‘grey water’ and it is useful for a multitude of things. So, if you start individually, adjusting, for instance, your plumbing system, taking in the water you waste as you shower and then storing it for flushing the toilet. That’s a good start. That will save substantially not only on your water bill but also on the environment. Take this a little further: You can have a little ‘pseudo’ treatment facility within your household and then you can irrigate your beautiful garden with the treated grey water. Consult with a landscape specialist and gradually transform your garden to include more native drought-resistant plants.
We also can use treated wastewater (after secondary or tertiary level of treatment) to replenish our thirsty aquifers. This has been done in many places around the globe and even locally. We can expand on the recharging efforts and continuously monitoring the aquifers’ water quality. Educating the public will help in eradicating any taboo regarding the origin of these volumes.
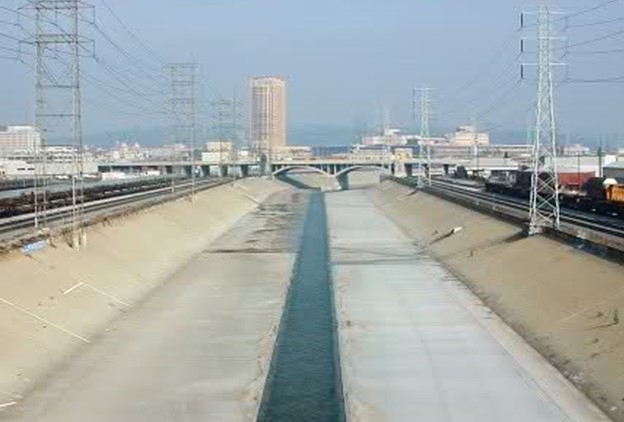
Looking at the channel in Figure 11, you will see that it is cement lined. This channel conveys water so quickly, so as rain occurs and stormwater runoff is generated, the channel receives stormwater from our streets and convey it very rapidly to the ocean.
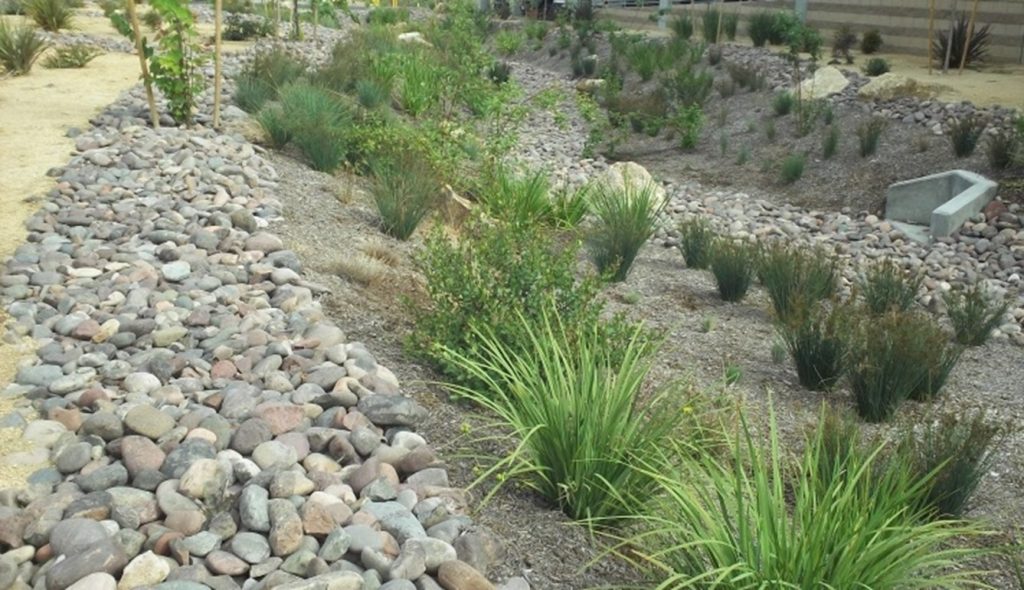
What about if we start thinking about another alternative? For instance, if you have a little ravine, or a stream or acequia (as the Arabs and Spaniards call it), why not make it as natural as possible if we’re not using it for irrigation purposes (see Figure 12)? This will help replenish some kind of local plants ecologically, and also feed the groundwater aquifer underneath it. So, you can really develop drainage channel next to something of value to the habitat around us, because after all we share this planet with a great deal of other creatures.
Conservation
By constantly remembering that the next drought may well be around the corner and by never forgetting the semi-arid area we are living in, we can start using recycled water more effectively and shift the paradigm to lower the demand for water instead of increasing the supply.
How do we bring the high levels of water consumption down? My hope is to bring down the individual consumption to around 122 liters per day, per capita, or even perhaps less. We can beat Germany. If they can do it there, maybe we can do a better job here. We can follow these simple steps. Step one: it starts with me. It starts with you. Every time we flush the toilet, every time we wash our faces or brush our teeth, and every time we wash the dishes or use a sprinkler, make certain that you are using low-flow technologies. These may seem like little measures, but you would be surprised how much water you will be able to save, and how those savings, multiplied by millions of people who live in Southern California, will add up. The goal of 150 or maybe 200 liters per day per capita is not out of our reach. Step two: to be released soon!
