Accreditation is an evaluation process based on a set of rigorous standards to ensure quality. In higher education, the term asserts that institutions are qualified and meet the expectations to grant degrees (Suskie, 2014). Accreditation seeks to evaluate the quality of colleges, universities, and other post-secondary programs in the United States. This process is oftentimes used outside the U.S. because of its standards of accreditation (Suskie, 2014). There are several types of accreditation, including regional, national, and specialized.
An accreditation process used when colleges and universities are not eligible for regional accreditation (Suskie, 2014).
An accreditation process that accredits colleges and universities in their entirety (Suskie, 2014).
An accreditation process that accredits specific programs (Suskie, 2014).
Anonymity is when no one (not even the researchers) can connect the data to the participant (Trochim et al., 2016). To achieve anonymity, no questions can be traced back to the individual and no identifying information is collected (Trochim et al., 2016). Examples include observations of strangers in public places, interviews where the person gives consent to participate but their name is never obtained by the researcher, and surveys that don’t ask for or collect any personal information (e.g., names, IP addresses).
Anonymity is the best way to protect participant privacy (Trochimet al., 2016); the second best way is confidentiality. Protecting participants’ data and privacy are important because one right of the participants is that no harm will come to them from participating in the study and because taking care of their safety matters.
In higher education, assessment is the evaluation of academic programs or institutional effectiveness through analysis of program resources, actions, and outcomes (Banta & Palomba, 2015). Assessment is conducted through a reflective process that includes dialogue with a range of stakeholders, such as students, faculty, and administration. The focus is on improving practice and student learning rather than generating theoretical knowledge (i.e., research).
Assessment methods for evaluating institutional effectiveness include the following (Banta & Palomba, 2015). They can be broadly categorized as either direct or indirect assessment methods.
- Electronic institutional portfolios
- Quality management
- Academic audits (i.e., external peer review)
- Performance assessments & indicators
- Course-embedded assessments
- League tables or rankings
- Outcomes assessments
- Student, faculty, graduates, and employer surveys
Authentic assessment is a type of performance assessment reflecting a higher standard whereby the assignment requires students to address real-world problems central to the discipline that are closely aligned to the course objectives (Banta & Palomba, 2015). An example is an observation of a student teaching. Authentic assessments promote student self-reflection and creativity, and they elicit increased student engagement and motivation.
Course-embedded assessments are often used as a component of program evaluation since they incorporate course activities and/or products already being assigned, completed, and graded. Analysis is often conducted in a collaborative format. Data might include objective tests, performance assessments, and rubrics (Banta & Palomba, 2015). The findings may result in institutional changes to instruction or assessments, such as changes that would lead to increased equity. Advantages of course-embedded assessments are that they are likely more cost-effective and less vulnerable to issues involving student motivation.
assessment, equity-centered
Equity-centered assessment is an umbrella term that “validates and attends to students’ identities and cultural backgrounds; considers how systemic bias and discrimination can affect learning and the student experience; exposes policies and procedures that promote bias and discrimination; and helps educational practice be more inclusive and equitable” (Lundquist & Heiser, 2020, para. 3). Few models have yet been developed (Henning et al., 2021). A key component is stakeholder (often student) engagement (Henning et al., 2021).
assessment for social justice
Assessment for social justice represents a shift in assessment beyond just evaluating diversity, equity, and inclusion programs and beyond evaluating student learning and program effectiveness, towards assessment with the purpose of promoting justice (Henning et al., 2021).
A collection of information showing assessment techniques being used in various programs or departments; it helps share information and provides a record of assessment methods being used (Banta & Palomba, 2015).
Direct assessment methods are measures of learning in which students demonstrate their knowledge and skills. Examples include tests/exams and performance assessments.
Indirect assessment methods evaluate students’ reflection on what they have learned and experienced in a course or program as opposed to observing direct evidence. Examples of indirect assessment methods include surveys/questionnaires, interviews, and focus groups.
Outcomes assessment is a practice in higher education that analyzes individual results together in order to understand patterns of strength and weakness among the group; these results then guide plans for improvement (Banta & Palomba, 2015). Outcomes assessment is a holistic approach carried out to better “understand how programs and institutions are working and to determine whether they are contributing to student growth and development” (Banta & Palomba, 2015, p. 9-10). The focus of the assessment is on programs rather than individuals (Banta & Palomba, 2015).
assessments, performance
Performance assessment is a form of direct assessment that allows students to demonstrate their competence in one or more skills through their own choices, ideas, writing, etc. (Banta & Palomba, 2015). Examples include a wide range of methods such as essays, presentations, projects, research papers, simulations, portfolios, problem sets, and oral examinations (Banta & Palomba, 2015). Performance assessments contrast with with multiple choice tests and other objective exams that provide predetermined answer choices (Banta & Palomba, 2015). Other aspects of performance assessments include the following (Banta & Palomba, 2015):
- Demonstrates planned learning outcomes in coursework
- May incorporate self-reflection based upon feedback and observation of other students’ performance
- Often associated with higher student motivation and engagement
In consideration of the impact of power and oppression on validity and knowledge, and given that whose voices are heard matters, performance assessments may be more equitable than objective tests (Hundley, 2021; First Peoples Principles of Learning, 2021; Campus Labs, e , 2021).
A signature assessment is a type of authentic assessment where the task is a central component of the course, intended to reflect a student’s best work in response to noteworthy questions and demonstrate the achievement of major course outcomes (Banta & Palomba, 2015).
Beneficence is a key principle in the Belmont Report which refers to the following (Trochim et al., 2016):
- Estimating the expected impact on a person that results from participating in the study;
- Minimizing those risks; and
- Maximizing benefits to the participants
Other principles of the Belmont Report include justice and respect for persons (Trochim et al., 2016)
big data
An assortment of data which are collected in various formats (e.g., structured, unstructured, numeric) and from multiple sources, such as large-scale surveys, databases, and real-time devices. (Hesse, Moser, & Riley, 2015)
Bloom’s Taxonomy is a learning taxonomy created by Benjamin Bloom that focuses on cognitive learning objectives. It is arranged in the following six levels of increasing complexity (Bloom, 1956):
- Knowledge
- Comprehension
- Application
- Analysis
- Synthesis
- Evaluation
A 2001 revision of Bloom’s Taxonomy added four levels of knowledge for students: factual knowledge, conceptual knowledge, procedural knowledge, and metacognitive knowledge (Anderson & Krathwohl, 2001).
Bologna Declaration
At a meeting in Bologna, Italy in 1999, a determination was made by 29 European countries to centralize higher education programs throughout Europe for improved communication, transferability, and quality assurance (Banta & Palomba, 2015). Similar frameworks have been developed in other nations and regions (Banta & Palomba, 2015).
A case study is a research method involving an in-depth investigation of a particular situation, context, or phenomenon (Trochim et al, 2016).
Complexity theory is used to explain and understand complex systems, issues, or problems. The three levels of complexity within the context of evaluation include simple, complicated, and complex (Bamberger et al., 2016). Mixed methods in evaluation can aid in understanding complex evaluands (Mertens, 2018b). Theorists have identified six different aspects of complex evaluands, which are (Patton, 2011):
- nonlinearity: Change does not always occur in a linear series of events. The use of mixed methods can contribute to meaningful perspectives derived from quantitative data to create a qualitative shift in a program, policy, system, or organization.
- emergence: Interactions between individuals and/or groups can become something beyond that what was intended. Mixed methods can be used to document the emergence of new meaningful perspectives resulting from the process of interaction.
- adaptive: Individuals and groups adapt through interactions by being exposed to new knowledge, practices, resources, relationships, and other elements. Mixed methods can be used to identify those elements.
- uncertainty: Uncertainty exists within complex problems, nature of problems, potential solutions, and responsiveness of stakeholders. Mixed methods can make areas of uncertainty visible which can lead to meaningful perspectives needed for progress.
- dynamical: Systems are interdependent and change at every interaction. Mixed methods allow for inclusion of approaches and changes to be recorded and tracked.
- coevolutionary: The organization and evaluator evolve together during the evaluation. The use of mixed methods can track this evolutionary process through quantitative and qualitative methodologies.
Confidentiality means that the researchers can connect the data to the participant and therefore knows their identity, but they are the only ones who know and do not share this with anyone else (Trochim et al, 2016).
This is the second best way to protect participant privacy, with the best way being anonymity. Protecting participants’ data and privacy are important because one right of the participants is that no harm will come to them from participating in the study and because taking care of their safety matters.
A curriculum map in higher education is used to organize data from a program or department to show outcomes organized by course, providing users with a clear map of curricular expectations (Banta & Palomba, 2015). Curriculum maps allow administrators to assess whether any of the program’s learning outcomes are being over-represented or under-represented across multiple courses (Banta & Palomba, 2015).
Concerning the analysis of words, qualitative analysis involves making judgements about what respondents have said or written about (Trochim et al., 2016).
- Content analysis is used for analyzing text (Trochim et al., 2016).
- Thematic analysis of text looks for themes in the text (Trochim et al., 2016).
- Indexing looks for key words by using an exception dictionary to eliminate irrelevant words such as the or is. This allows the researcher to see how often a word is used by respondents and in what context (Trochim et al., 2016).
- Word clouds are used to analyze short answer responses. However, they only tell the frequency of a word, not respondents’ connotations or meanings of the word.
In order to remain unbiased, qualitative research should be judged using the following criteria (Lincoln & Guba, 1985):
- credibility: Do respondents believe results of research reflect their views?
- dependability: Does the measurement tool consider the complexities of the research environment?
- confirmability: Data audits and triangulation can assist in establishing the researcher’s unique perspective of a study.
- transferability: Can results be transferred or generalized in other contexts? (this is determined by the person looking to apply this study to a different context)
Data analysis for quantitative analysis involves two significant steps, preformed typically in this order (Trochim et al., 2016):
The process of cleaning and transforming raw data before processing and analysis (Trochim et al., 2016). It involves screening and logging the data; making a codebook; entering the data; checking the data for accuracy; transforming the data; and developing and documenting a database that integrates all of the measures (Trochim et al., 2016).
Dialectical pluralism is a metaparadigm that involves dialogue (dialectical), logical thinking (dialogical), and critical reflection to construct a reality that involves multiple perspectives, including but not limited to the perspectives of other researchers, stakeholders, participants, and competing paradigms (Johnson & Schooneboom, 2015).
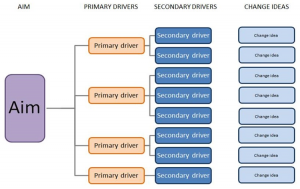
Driver diagrams are used to make a theory explicit by using a diagram to describe the theoretical framework used to reach a program’s or policy’s end goal (Bryk et al., 2015). There is no single correct driver diagram, and they often change over time as understandings develop on how a program or policy achieves the end goal (Bryk et al., 2015). Driver diagrams created collaboratively can promote team buy-in, greater understanding, and greater contributions (Bryk et al., 2015).
Driver diagrams consist of one or more aims on the far left, drivers in the middle, and change Ideas on the far right of the diagram (Bryk et al., 2015).
- Aims: The aims answer the question “What are we trying to accomplish?”
- Tips for Crafting a Good Aim statement:
- Think about scoping. The scope should be both ambitious and realistic.
- Think about the will of the people you need to involve.
- Think about your ability to influence those people.
- Tips for Crafting a Good Aim statement:
- Driver: The drivers answer the question “How will we know that a change is an improvement?”
- Change Ideas: The change ideas answer the question “What change can we make that will result in improvements?”
educational effectiveness research (EER)
A tool used to “determine the impact of schools on student progress rather than on the final learning outcomes.” EER “can be seen as a combination of research findings in different areas: research on teacher behavior, curriculum, grouping procedures, school organization, and educational policy” (Kyriakides, 2018, p. 5).
The idea that expected educational outcomes should reflect student effort and ability and should not be determined or limited by a student’s identity or circumstances (in other words, uncontrollable factors such as gender, ethnicity, or socioeconomic status, or interactions between any of these factors) (Kyriakides, 2018).
There are two broad views of how equity is achieved in education (Kyriakides, 2018):
- The meritocratic view of educational equity assumes success is based on individual qualities such as cognitive ability, effort, or talent. It places the onus of educational achievement and success on the student. All students are given the same tools and support, despite individual characteristics or circumstances (Kyriakides, 2018).
- The egalitarian view of educational equity argues that society is responsible for ensuring equitable educational success and that schools and educators should provide support and resources for students according to their need. This has become the mainstream view of educational equity (Kyriakides, 2018).
Educational equity can be examined in two ways (Kyriakides, 2018):
- Equity as inclusion refers to “providing a basic minimum standard of education for each and every student” (Kyriakides, 2018, p. 9). An example would be a school requiring a science class of all students, but also offering an optional lab component for the class that students can enroll in for an additional fee to cover lab supplies; all students are provided with a minimum standard of the required class, but not equal access to the lab.
- Equity as fairness refers to “ensuring that personal and social circumstances” are not “an obstacle to educational success” (Kyriakides, 2018, p. 9). These circumstances can include “gender, ethnic origin or family background” (Kyriakides, 2018, p. 74). Following the example above, equity as fairness would mean allowing all students to participate in the science lab regardless of whether they have the means to pay for lab supplies.
The focus or subject of an evaluation such as a program, policy, system, or an organization (Mertens, 2018a).
Intentional investigative activity examining a program or policy’s plans, processes, outcomes, or impacts. Evaluation involves comparing the findings against some standards; results in judgements about the merit, value, and worth of the thing evaluated; and informs stakeholders‘ decisions regarding the thing evaluated (Wanzer, 2021).
Evaluation studies focus on the utility of the findings for the clients and are nearly always conducted on the ground in the program setting with stakeholder involvement. Assessment is a part of evaluation.
evaluation, branches of
There are four widely recognized branches of evaluation which reflect paradigms that evaluators use when doing their work (Mertens, 2018a).
- positivism and post-positivism paradigm (Methods Branch) prioritizes the use of research methods as techniques to conduct evaluation (Alkin & Christie, 2013).
- pragmatism (Use Branch) promotes the use data to assist stakeholders in making informed decisions (Alkin & Christie, 2013).
- constructivist paradigm (Values Branch) focuses on valuing data with the purpose of establishing credibility (Alkin & Christie, 2013).
- transformative paradigm (Social Justice Branch) includes the voices of communities who have historically been marginalized for the purpose of creating transformative, systemic, and equitable change (Mertens & Wilson, 2012).
Another approach which aims to blend the above approaches is dialectical pluralism (Mertens, 2018a).
Impact evaluations aim to to determine how effectively a program achieved its goals by using randomization and control groups to determine whether outcomes or changes in outcomes can be directly attributed to a specific intervention (Kyriakides, 2018).
Kyriakides (2018) identifies two dimensions of impact evaluations in education:
- Quality Dimension of Educational Evaluation: This type of evaluation is based on student learning outcomes. It measures learning outcomes by assessing what has been achieved and if that achievement is more, less, or the same as what was expected.
- Equity Dimension of Educational Evaluation: This type of evaluation is based on educational fairness. It measures outcomes by investigating whether the gap in achievement between students from different backgrounds has been reduced, remained the same, or been increased.
The diagram below outlines the two dimensions of measuring effectiveness and highlights the relationship between the quality and equity dimensions of education (Kyriakides, 2018).
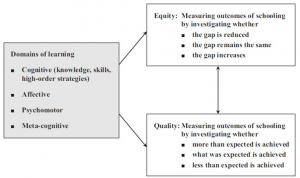
(Diagram taken from Kyriakides, 2018, p. 10)
A research instrument that has the design of a group interview in which the researcher facilitates discussion among participants (Trochim et al., 2016). In essence, each participant shares their opinions and listens to those of their group mates. An advantage of focus groups is that they allow the researcher to get a comprehensive and concise view of a particular group’s attitudes, opinions or preferences about a topic. However, there are some drawbacks to focus groups. For instance, social desirability bias might cause certain opinions and perspectives to remain hidden (Trochim et al., 2016).
Generalizability refers to the ability to extend the conclusions from the sample to the broader population.
Holistic scoring results in one overall impression via one score (Banta & Palomba, 2015). This score encompasses all components of the assessment. Holistic scoring does not provide feedback about strengths and weaknesses and is best used with a limited number of outcomes (Banta & Palomba, 2015).
improvement science
A systematic problem-solving approach centered on continuous inquiry and learning (user-centered and problem-centered) in order to enhance practice/policy by increasing effectiveness and improving outcomes (Bryk et al., 2015). Change ideas are tested in rapid cycles, resulting in efficient and useful feedback to inform system improvements (Sherer et al., 2020). This process also helps illuminate when a change is an improvement (i.e., what works), for whom, and under what conditions (Bryk et al., 2015; Sherer et al., 2020). The six basic improvement principles are (Bryk et al., 2015):
- Make the work problem-specific and user centered
- Focus on variation in performance
- See the system that produces
- We cannot improve at scale what we cannot measure
- Use disciplined inquiry to drive improvement
- Accelerate learning through networked communities
Improvement science aims to prevent solutionitis from occurring (Bryk et al., 2015).
index
A combination of different quantitative variables put together using a set of rules that form a single score used to measure something over time (Trochim et al., 2016). An example of an index is the Socioeconomic Status (SES) Index which combines three different variables: income, education, and occupation. Another example is the Consumer Price Index (CPI) (Trochim et al., 2016).
internships
A type of direct performance assessment which involves professional real-world experiences that engage students in a specific field of study (Banta & Palomba, 2015).
A research instrument in which the interviewer coordinates a conversation and asks questions to an interviewee.
- semi-structured interviews: An interview process where the interviewer asks a set of predetermined open-ended questions but can also ask other questions based on the flow of the conversation (Banta & Palomba, 2015).
- unstructured interviews: An interview process which allows the interviewer to fully adjust and modify questions based on the flow of conversation (Banta & Palomba, 2015).
A key principle in the Belmont Report which refers to the following (Trochim et al., 2016):
- Determining who gets to participate in the study based on fairness (not circumstances);
- Doing recruiting with respect for persons; and
- Sufficiently compensating people for their time spent/inconvenience due to them participating.
Compensation is not considered a benefit of participation; rather, it’s considered a way to incentivize people to participate and remain in the study (Trochim et al., 2016).
When determining what sufficient compensation means, researchers may consider a person’s hourly wages and the number of hours participation involves. Then they provide an amount that attempts to offset the inconvenience of participating. However, inappropriately high compensation has the threat of attracting people who may be vulnerable economically—if they are in need of the money, they may not feel like they can voluntarily decline or quit participating.
Other principles of the Belmont Report include beneficence and respect for persons (Trochim et al., 2016).
The relationship or meaning between numerical values. Below are four levels of measurement that help us interpret data (Trochim et al., 2016):
- nominal: Qualitative variables that do not hold any ranking order nor numerical measure. Nominal variables do not necessarily contain letters or names. Note that nominal variables can be described as frequencies and percentages (e.g., percent male and percent female) when communicating the findings.
- Example: party affiliation, hair color, city, social security number, zip code
- ordinal: Variables that have directionality and a range to show higher or lower. Note that while the variables can be ordered values (such as 0, 1, 2, etc.), the distance between 0 and 1 are not necessarily equal. In other words, ordinal variables do not have an interpretable distance.
- Example: t-shirt size; educational attainment level; coffee cup size; first, second, and third place in a race
- interval: Variables that have measurable and interpretable distance between attributes with an arbitrary zero.
- Example: Degrees, SAT scores, Year
- ratio: Variables that have interval measurement with a meaningful absolute zero.
- Example: Weight, # of Clients, Distance
learning goals
Learning goals are designed for macroscopic meaning, the development of society or community. Learning goals are used to express intended results in general terms and consist of broad learning concepts such as clear communication, problem solving, and ethical awareness (Banta & Palomba, 2015). They are developed through a consensus of a cross-section of the campus community (Banta & Palomba, 2015).
Learning objectives are designed for microscopic meaning, the development of the student’s self. These objectives are developed by faculty and staff for specific academic or cocurricular programs that they provide (Banta & Palomba, 2015). They describe expected student learning and behavior in precise terms, providing guidance for what needs to be assessed (Banta & Palomba, 2015). In other words, they provide clarity and focus on the priority topics which are determined by faculty, staff, etc.
Learning taxonomies allow educators to distinguish learning outcomes between cognitive (what students know), affective (what students value), and psychomotor (what students can do) outcomes (Banta & Palomba, 2015). One example is Bloom’s Taxonomy (Bloom, 1956).
logic model
A logic model is a simplified picture of a program, initiative, or intervention that shows how the logical relationships among the resources that are invested, the activities that take place, and the benefits or changes that result (W. K. Kellogg Foundation, 2004). It may show how the program is expected to work or how it has been proven to work (W. K. Kellogg Foundation, 2004). Logic models help with planning a new program/initiative and with evaluating the effectiveness and functioning of existing ones (W. K. Kellogg Foundation, 2004). They are usually created in collaboration with stakeholders (W. K. Kellogg Foundation, 2004).
A method in evaluation and research in which quantitative and qualitative methodologies are strategically sequenced to collect, analyze, and integrate data (Mertens, 2018b). The purpose of mixed methods is to develop meaningful perspectives that a single method is unable to capture (Mertens, 2018b). There are several mixed method designs (Creswell & Plano Clark, 2018):
- convergent design (previously known as the concurrent or parallel design): A mixed methods design in which the researcher collects and analyzes two separate databases, quantitative and qualitative, and then merges the two databases in order to compare the results. The purpose of this design is to find different but complementary data on the same topic (Morse, 1991).
- explanatory sequential design (also referred to as explanatory design): A mixed method design that begins with collection and analysis of quantitative data followed by the collection and analysis of qualitative data in order to explain, compare, or to further explore findings from the initial phase of quantitative results.
- exploratory design (also referred to as exploratory design): A three-phase mixed methods design that initially starts with the collection and analysis of qualitative data or qualitative data which is then explored to identify if a new quantitative tool needs to be designed and/or enhanced (Creswell & Plano Clark, 2018). The newly designed quantitative tool is then tested and data is collected (Creswell & Plano Clark, 2018). Finally, this process is concluded by the interpretation of both (qualitative and quantitative) findings and the reporting those findings.
In contrast with performance assessments, objective tests in educational assessment include items (i.e., questions) that have choices (i.e., answers) created by others, such as multiple choice and true/false questions (Banta & Palomba, 2015). Objective tests do the following (Banta & Palomba, 2015):
- Can incorporate a wide breadth of knowledge and require less of the researcher’s time to analyze
- May be less successful at incorporating nuance and complex questions
- Include well-written items which have clear language, have answers of similar complexity, avoid “all of the above” and “none of the above” options, and are linked to set outcomes
Facilitators should anticipate that students may need up to three times as long as teachers to complete an objective test (Banta & Palomba, 2015).
A type of objective test that this widely administered and scored using consistent processes regardless of time or location (Banta & Palomba, 2015). Possible negative effects include increased test anxiety, decreased self-confidence, and an overreliance on habits like teaching to the test. The use of standardized objective tests should be analyzed through a critical lens to ensure that student cultural capital is being reflected.
A way of gathering qualitative data through watching behaviors and events and by noting physical characteristics. There are several approaches to conducting observations:
- direct observation: A more detached approach where the researcher doesn’t become attached to the community or context when collecting data.
- participant observation: A less detached approach where the researcher becomes an active participator in the culture or context in order to collect data.
operationalize (operationalization)
The translation of an abstract idea into something real, such as by describing exactly how a concept will be measured. Operationalization helps convert (or translate) a theoretical cause-and-effect principle into something concrete that can be measured, for example a program and its outcomes.
Plan-Do-Study-Act cycle (PDSA)
The Plan-Do-Study-Act cycle serves as a basic learning tool through which practitioners test changes, document the results, and revise their theories about how to achieve their aim(s)(Bryk et al., 2015; Sherer et al., 2020). The crucial aspect of the PDSA approach is that it is small-scale testing with minimal costs, quick learning, and nimble adjustments. With these repeated cycles of small-scale testing, an organization can identify ways to achieve positive results reliably and at scale (Bryk et al., 2015; Sherer et al., 2020).
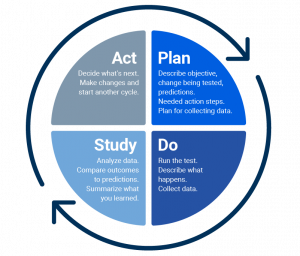
(Image taken from https://www.smartsheet.com/content/plan-do-study-act-guide)
A type of direct performance assessment in which students collect work over time, providing longitudinal data to and allows students to reflect on their individual learning, that can prove helpful in guiding student learning (Banta & Palomba, 2015). Portfolios allow students to demonstrate what they have learned in a nontraditional format and encourage student autonomy.
A specific type of direct performance assessment which is a digital archive of students’ work, artifacts, reflective writing, etc., that demonstrate student growth and learning over time according to set outcomes (Banta & Palomba, 2015). Researchers need to consider validity and reliability, the additional time required, and that participants will require training to grade electronic portfolios. Electronic portfolios:
- Typically increase student engagement since students may be able to choose their own work and reflect on their rationale for inclusion;
- Can be personalized and/or customized to a particular discipline; and
- Incorporate opportunities for feedback, student reflection, and higher-order thinking skills such as cross-course connections.
Connect to Learning Project is an e-portfolio resource that incorporates 24 college campuses: http://c2l.mcnrc.org/
The concept that two groups would on average perform identically if measured to an infinite extent.
problems of practice
Problems of practice are persistent, contextualized, and specific issues embedded in the work of a professional practitioner (University of Pittsburg, n.d.). Addressing a problem of practice can potentially result in improved understandings, experiences, and outcomes (Bryk et al., 2015). Problem of practice should be local but also grounded in a larger universal frame (University of Pittsburg, n.d.).
An actionable problem of practice is (Bryk et al., 2015):
- urgent for the organization (the problem arises out of a perceived need)
- actionable (the problem exists within the individual’s sphere of influence)
- feasible (the problem can be addressed in a limited timeframe with the available resources)
- strategic (the problem is connected to the goals of the larger organization)
- tied to a specific set of practices (the problem is narrowed to specific practices that have a good change of improvement)
- forward looking (the problem reaches towards the next level of work)
A type of direct performance assessment which may include research papers, presentations, theses, dissertations, exhibitions, oral presentations, demonstrations, design competitions and case studies (Banta & Palomba, 2015).
Qualitative data are collected in a variety of ways including through a case study, focus groups, observations, short answers in surveys, interviews, journaling, photography, and certain unobtrusive measures.
A term used to infer that a certain expectation and level of criteria is being met in higher education settings. The five dimensions of quality are listed below (Suskie, 2014).
- Relevance is explained as the connection students have with the college (e.g., The university using donor’s money to provide financial aid students).
- Community recognizes that higher education is a collection of folks and networks that allow for it to function (e.g., having campus partners, faculty, and staff).
- Focus and aspiration is about understanding the goals of students and helping them achieve those goals (e.g., providing academic advising)
- Evidence is used to keep the institution accountable and ensure that goals are being met. In addition, evidence helps to ensure that progress is being made to meet the goals (e.g., graduation rates, retention rates).
- Betterment in terms of ensuring quality means that an institution must always be evolving and self-improving (e.g., how well did the campus support students during the pandemic?). “Betterment is the foundation of the other four cultures of quality” (Suskie, 2014, p. 69).
The process of conducting external peer review and self-study of higher education institutions to determine effectiveness via institutional audits and the dissemination of information on best practices. Having a national/international quality assurance agency is important for quality assurance compliance, standardization of assessment tools across institutions, and allowing for checks and balances between institutions.
The process of randomly assigning participants (e.g. flipping a coin, using a random-number generator on a computer or online) into subgroups.
- experimental group: The subgroup receiving the treatment or program of interest
- control group: The subgroup not receiving the treatment or program of interest
Note that random assignment is different from random selection when sampling.
Reliability refers to the consistency and dependability of the data. In other words, reliability tells us the extent that the measurements are consistent and repeatable. Reliability can be seen as a fraction or ratio ranging from 0 (representing totally random and fully dictated by error) and 1 (representing a 100% a reflection of the truth).
Reliable measures can be counted on to produce consistent responses over time. The scores/data resulting from the instrument of measurement should be tested for reliability rather than the instrument of measurement itself. Reliability has different names based on the instrument used to collect the data:
- internal consistency: The level of how well items on a test or survey are related to each other in measuring the same construct.
- interrater reliability: The degree of agreement among two or more raters.
Systematic inquiry examining a thing which aims to be impartial and non-judgmental; results in generalizable, rigorous findings; and increases the public theory/knowledge base. Basic research studies occur both in controlled settings and on the ground depending on the thing being studied and how it’s being studied. The findings are commonly published in academic journals and then learned about and used by other researchers.
This term refers to a wide variety of things relating to how to do research/evaluation. It can refer to the:
- The steps of the study (e.g., determining the key questions, design/approach, sampling, data collection, qualitative and quantitative data analysis)
- Broad category of the study (e.g., qualitative, quantitative, mixed methods)
- Design of the study (e.g., experimental, quasi-experimental, nonexperimental)
- Various ways to collect data (e.g., survey, observation, interview, unobtrusive measures)
A key principle in the Belmont Report which refers to:
- Treating people as independent, autonomous individuals (and protecting the well-being of those who aren’t fully independent and/or autonomous );
- Following informed consent processes when signing up someone to be a participant; and
- Considering the relative risk of harm to any participant.
Informed consent processes help to inform potential participants and provide them with an avenue to maintain the voluntariness of their participation in the study. Special considerations for informed consent processes include situations where individuals are not fully independent and/or not autonomous (Trochim et al., 2016). Examples include:
- Properly gaining informed, voluntary assent from children (after their parents provide consent);
- Situations where people that are not able to make informed decisions or make decisions in their own best interest; and
- Situations where people’s decisions are restrained by the situation/context, such as in individuals who are incarcerated, boss-employee relationships, and professor-student relationships.
When gaining informed consent, the information must be communicated in the participant’s native language, at their reading level, and in a way that they will best understand (possibly involving videos and pictures). In short, the researcher must do everything in their power to promote comprehension of the study, the potential participant’s role in it, the benefits and risks, and the never-ending voluntariness of participation.
Other principles of the Belmont Report include beneficence and justice.
Rubrics are standardized frameworks used when evaluating performance assessments (Banta & Palomba, 2015). Multiple characteristics, components, or outcomes are listed as rows and multiple rating options are listed as columns. Best practices for creating rubrics include:
- Use clear, descriptive language;
- Include extensive detail for each rating level to communicate clear expectations;
- Test to avoid over- or under-weighting any components; and
- Avoid oversimplification of the concepts.
There are many different types of rubrics, including analytic rubrics, value rubrics, and holistic scoring.
A type of rubric which incorporate multiple characteristics, components, or objectives (each with their own score) into one rubric score (Banta & Palomba, 2015). They clearly define the evaluation criteria and work well for assignments that are complex, have multiple components, or represent multiple objectives.
The American Association of Colleges and Universities has created 16 value rubrics, also called standard rubrics, that were developed to link rubrics used in the classroom with rubrics used to assess institutional effectiveness (Association of American Colleges and Universities, n.d.; Banta & Palomba, 2015). These standard rubrics can be modified to fit the needs of an institution and are intended to be used on an organization-wide basis.
The process of selecting units, such as participants, organizations, or items, from a larger population that one is interested in researching. Once a group is selected to be in the study, that is called the sample. The people who actually participate in the study are called a sub-sample (Trochim et al., 2016). There are two major approaches to consider when sampling.
- random (probability) sampling: A sampling process in which every individual has an equal chance of being selected. More often this sampling process is used for larger groups. This is also called random selection.
- purposive (nonprobability) sampling: A sampling process in which units are selected based on the researchers’ judgement, experience, or even access to potential participants. This process has the greater potential for bias. The chance of someone being selected is not known. This sampling process is often used for smaller trials, case studies, focus groups, or as a pilot to justify or prove the feasibility of a larger study.
There are several types of random and nonrandom sampling methods. While random sampling tends to have a stronger generalizability, the researcher should closely consider their research question, their access to the population, people’s willingness to participate, and many other factors when selecting the most appropriate sampling method.
Note that random sampling is different from the random assignment of a sample into a control or treatment group.
scales (scaling)
Scales, created through a scaling process, are used to measure abstract concepts. They function by associating qualitative constructs (objects) with quantitative units (numbers) typically resulting in a single numerical score (Trochim et al., 2016). In general, qualitative constructs are statements that correspond to some numerical value (Trochim et al., 2016). According to psychologist S.S. Stevens, “Scaling is the assignment of objects to numbers according to a rule” (1959, p. 25).
Scaling is different from a response scale. Scaling refers to the process or procedure used to come up with an instrument that assigns numbers to objects. In contrast, as response scale refers to a way of collecting responses to an item on a survey which might take the form of a 1-5 rating (Trochim et al., 2016).
“A method of [unidimensional] scaling in which the items are assigned scale values that allow them to be placed in a cumulative ordering with respect to the construct being scaled” (Trochim et al., 2016, p. 155). Gutman scaling is also referred to as cumulative scaling. On a ten-item cumulative scale, when respondents score a four, it indicates that they agree with the first four items (Trochim et al., 2016).
A Gutman scale is created by following these steps:
- Step 1: The focus of the scale project
- Step 2: Come up with a set of items
- Step 3: Have a group of judges rate how favorable the item is to the concept you are trying to measure
- Step 4: Use scalogram analysis to create the cumulative scale
- Step 5: Administer the scale; respondents’ scores are calculated by adding the scale values of the items the respondents agreed with (Trochim et al., 2016).
A unidimensional scaling method that measures the degree of agreement with statements expressing attitudes or ideas. For an example of a Likert scale, consider The Rosenburg Self-Esteem Scale (Trochim et al., 2016).
When it is not possible to measure the construct with a single number line, multidimensional scaling must be used. For instance, academic achievement is a multidimensional construct because there are multiple ideas that could be seen as working together to quantify academic achievement, such as aptitude and motivation (Trochim et al., 2016).
“A class of [unidimensional] scaling methods designed to yield unidimensional, interval level, multi-item scales” (Trochim et al., 2016, p. 150). For example, one method under Thurstone scaling is called the method of equal-appearing intervals, which is created by following these steps:
- Step 1: Develop the focus of the scale project. The concept you are investigating must be unidimensional.
- Step 2: Come up with potential items to for the scale
- Step 3: Have a group of judges rate how favorable the item is to the concept you are trying to measure on a 1 to 11 scale
- Step 4: Compute median and interquartile range for each item
- Step 5: Choose the final scale items based
- Step 6: Administer the scale
A specific group of scales where the construct can be measured well with a single number line. For example, height, weight, and thirst are unidimensional. These concepts are easier to understand compared to multidimensional concepts. Unidimensional scales include Likert scales, Thurstone scales, and Guttman scales.
A type of direct performance assessment which is utilized when it is not feasible to demonstrate skills in a real-world setting (Banta & Palomba, 2015). Artificial situations mimic real world scenarios to assess students’ capabilities and problem-solving skills.
A situation where a problem is identified and a solution is provided without fully considering the bigger picture, which can lead to a not-so-great solution (Bryk et al., 2015).
The people who are impacted by the program (such as staff, clients, funders, community members) and who may be impacted by the evaluation. An evaluation inevitably involves—and is often shaped by and for—specific stakeholders.
- In descriptive studies or some relational studies, the researcher would include short descriptive summaries. Descriptive statistics highlight the data characteristics.
- In experimental and quasi-experimental designs, this would include more complex methods to answer and test the research hypotheses, such as inferential statistics.
statistical analysis, descriptive
Descriptive statistics provide meaningful numeric descriptions of the sample in order to uncover patterns in the data (Trochim et al., 2016). It’s important to pair descriptive statistics with graphical analysis so the broad picture of the data is clearly understood. Descriptive statistics can divided into the following three categories (Trochim et al., 2016):
- Distribution is the summary of the frequency of values.
- Central tendency is an approximation of the middle of the distribution values (Trochim et al., 2016).
- Mean is the average of the values.
- Median is the value in the middle of the set of values.
- Mode is the most common value.
- Dispersion is the range of values around the central tendency (Trochim et al., 2016).
statistical analysis, inferential
Numeric analysis that enables data from one application to be mapped onto a larger context (Trochim et al., 2016). Inferential statistical analysis also reveals information about effect size (Trochim et al., 2016).
A research instrument that involves asking people to provide information with respect to their opinions, beliefs, and behaviors (Trochim et al., 2016). Generally, questionnaires are self-administered, and the researcher does not have the opportunity to probe and ask follow-up questions.
Surveys and questionnaires usually do not require as much time or resources to administer compared to interviews and focus groups.
There are several different types of surveys with some of the most common being mail, electronic, and group-administered questionnaires (Trochim et al., 2016). It should be noted that investigators have to consider many factor before deciding which type to employ, such as the characteristics of the target population and the resources available (Trochim et al., 2016).
In general, survey questions may be divided into two types: unstructured and structured. Unstructured questions are open-ended questions allowing the respondent to write in whatever they want to. Unstructured questions usually only require a short response, so they are also commonly called short answer questions. On the other hand, structured questions provide a choice of answers from which the respondent selects their answer.
Tests are used as a data collection instrument to assess knowledge, recall, or skill as objectively as possible (in contrast with scales). In evaluation, tests are also called exams and are an example of a direct assessment method. The reliability and validity of tests are a key issue. Examples include multiple choice, true/false tests, essays, and oral exams. An important note to remember is that the construct should define the test; the test should not define the construct (Trochim et al., 2016).
tuning
The process of creating field-specific standards for degrees that are valid across different institutions and/or countries (Banta & Palomba, 2015).
A way of collecting data that does not interfere with research subjects’ lives, usually in an effort to minimize bias that could result from the interference.
Any nonnumerical, descriptive data that results from qualitative data collection methods. Examples include video/audio recording, pictures, written responses, and verbal responses.
The accuracy of an observation. This refers to the closeness of what you intend to measure with what you actually measure. Validity is reliability while also accounting for the item being measured. Evaluating validity begins with clarifying purpose, intended interpretations, and likely uses. There are several different types of validity including construct validity, content validity, criterion-related validity (predictive validity and concurrent validity), external validity, face validity, and conclusion validity.
Conclusion validity considers how reasonable the relationship between the variables are. There are two types of errors that a researcher can make when describing relationships in data.
- Type I Error refers to when the researcher concludes there is a relationship when there is not. This error is also known as a false alarm or a false positive.
- Type II Error refers to when the researcher concludes that there is no relationship when there is. This error is also referred to as a miss or false negative.
A type of validity that focuses on how well your measures reflect your theory. Consider measures to be the actual program occurring in the world, while theory is the concepts you think the program should be. In other words, construct validity is the congruence between the meaning of the underlying construct and the items on the test or survey.
A type of validity that focuses on the overall match between the content of the instrument and the content of the curriculum or other domain of interest.
This type of validity includes predictive validity (evaluating the dependability of the relationship between scores/answers on an instrument and an outcome) and concurrent validity (evaluating the use of a test for predicting other outcomes).
A type of validity that focuses on how well conclusions from the study can be held to the broader population while considering time and place. External validity can be strengthened in many ways, including the more a researcher has a sample which is representative of the target population and the more the study can be replicated in different contexts.
A type of validity that subjectively assesses (solely based on individual judgement) whether, on its face, a measurement tool seems appropriate for measuring the thing that it’s trying to measure (aka, the construct). Face validity checks to determine if the operationalization is a relevant translation of the program.
Problems that encompass interdependent system in which no clear solution exists, only “better or worse solutions” (e.g., inequity, violence in schools, student bullying)(Rittel & Weber, 1973, p. 163).
